Module 3b: Economic damages associated with health impacts
Source:vignettes/Module3b_health_eco.Rmd
Module3b_health_eco.RmdDescription
The functions in this module estimate economic impacts associated with the adverse health effects attributable to ambient air pollution. There are two different indicators that are produced. First, the tool estimates “absolute” monetized damages associated with both PM2.5 and O3, based on the “Value of Statistical Life (VSL)” approach. Second, the model allows to calculate which are the impacts of PM2.5 concentration levels on GDP growth. These two metrics are explained in more detail in the folowing subsections.
Values of Statistical Life (VSL) approach
Absolute economic damages associated with the health impacts are calculated multiplying the computed premature mortalities by the corresponding Value of Statistical Life (VSL). The VSL is based on the widely accepted OECD value for 2005. Following existing literature, this value ranges between US$1.8 and $4.5 million for VSL. The calculations for all regions are based on the “unit value transfer approach” which adjusts the VSL according to their GDP and GDP growth rates, as detailed in Narain and Sall, 2016.
In this version, we assume the income elasticity of the VSL is by
default equal to 0.8, with no adjustments across regions. Anyway, this
value can be easily modified by the user by changing the
inc_elas_vslparameter. Finally, the damages reported by the
functions use the median values of VSL. The reporting of Lower and Upper
Bounds can be selected by the user with the
Damage_vsl_range parameter (VSL_med, VSL_low, or
VSL_high).
Impacts on GDP growth
Apart from the absolute economic damages, the tool can also report
the impacts of PM2.5 concentration on GDP growth. The calculations are
based on the panel data fixed-effects regression model described in Dong et al, 2021.
In this study, the authors estimate a beta parameter that
can be multiplied to PM2.5 concentration levels to get the effect of air
pollution in GDP growth.
Considering that the estimation of the parameter is based on the
Chinese economic system, the betaparameter in
rfasst is re-calibrated for the different regions in the
model mimicking the “unit value transfer approach” described in the
previous subsection.
We note that the results should not be interpreted as “GDP growth
rates”. What the outputs from this function represents is the negative
impacts that PM2.5 has on GDP growth. For example, if we get that the
effect for region Xin period t is -0.25% and
its
is expected to be 3%, the final (net) GDP growth would account for
2.5%.
Example for the estimation of economic impacts
The following code shows an example for the monetized premature deaths associated to exposure to PM2.5:
library(rfasst)
library(magrittr)

 db_path<-"path_to_your_gcam_database"
 query_path<-"path_to_your_gcam_queries_file"
 db_name<-"name of the database"
 prj_name <- "Name of the rgcam project" # This can be an existing project, or, if not, this will be the name
 rdata_name <- "Name of the RData file." #It must contain the queries in a list
 scen_name<-"name of the GCAM scenario"
 queries<-"Name of the query file" # (the package includes a default query file that includes all the queries required in every function in the package, "queries_rfasst.xml")
 final_db_year <- "Final year in the GCAM database" # This allows to process databases with user-defined "stop periods"
 saveOutput <- T # Writes the files.By default = T
 map <- T # Produce the maps. By default = F
 recompute <- F  # If set to T, recomputes the function output. Otherwise, if the output was already computed once, it uses that value and avoids repeating computations. By default = F
 ssp <- "SSP2" # Set the ssp narrative associated to the GCAM scenario. c("SSP1","SSP2","SSP3","SSP4","SSP5"). By default is SSP2
 mort_model <- "GBD" # Select the health impact model (GBD, GEMM, or FUSION). By default = GBD
 Damage_vsl_range <- "VSL_med" # Select the VSL to calculate the damages (VSL_med, VSL_low, or VSL_high). By default = VSL_med
 inc_elas_vsl <- 0.8 # Select the income elasticity. Normally c(0.8, 1, 1.2). By default = 0.8

# Example for economic damages associated with PM2.5 exposure using the VSL approach
m3_get_pm25_ecoloss_vsl<-function(db_path = NULL, query_path = "./inst/extdata", db_name = NULL, prj_name = "test.dat",
                                   rdata_name = NULL, scen_name = scen_name, ssp = "SSP2", final_db_year = 2100,
                                   mort_model = "GBD",  Damage_vsl_range = "VSL_med", inc_elas_vsl = 0.8,
                                   queries = queries, saveOutput = T, map = F, anim = F, recompute = F)
As in other modules, for all these functions, the package allows to
produce different figures and/or animations, generated using the rmap package documented in the
following page. To generate
these maps, the user needs to include the map = T
parameter, and they will be generated and stored in the corresponding
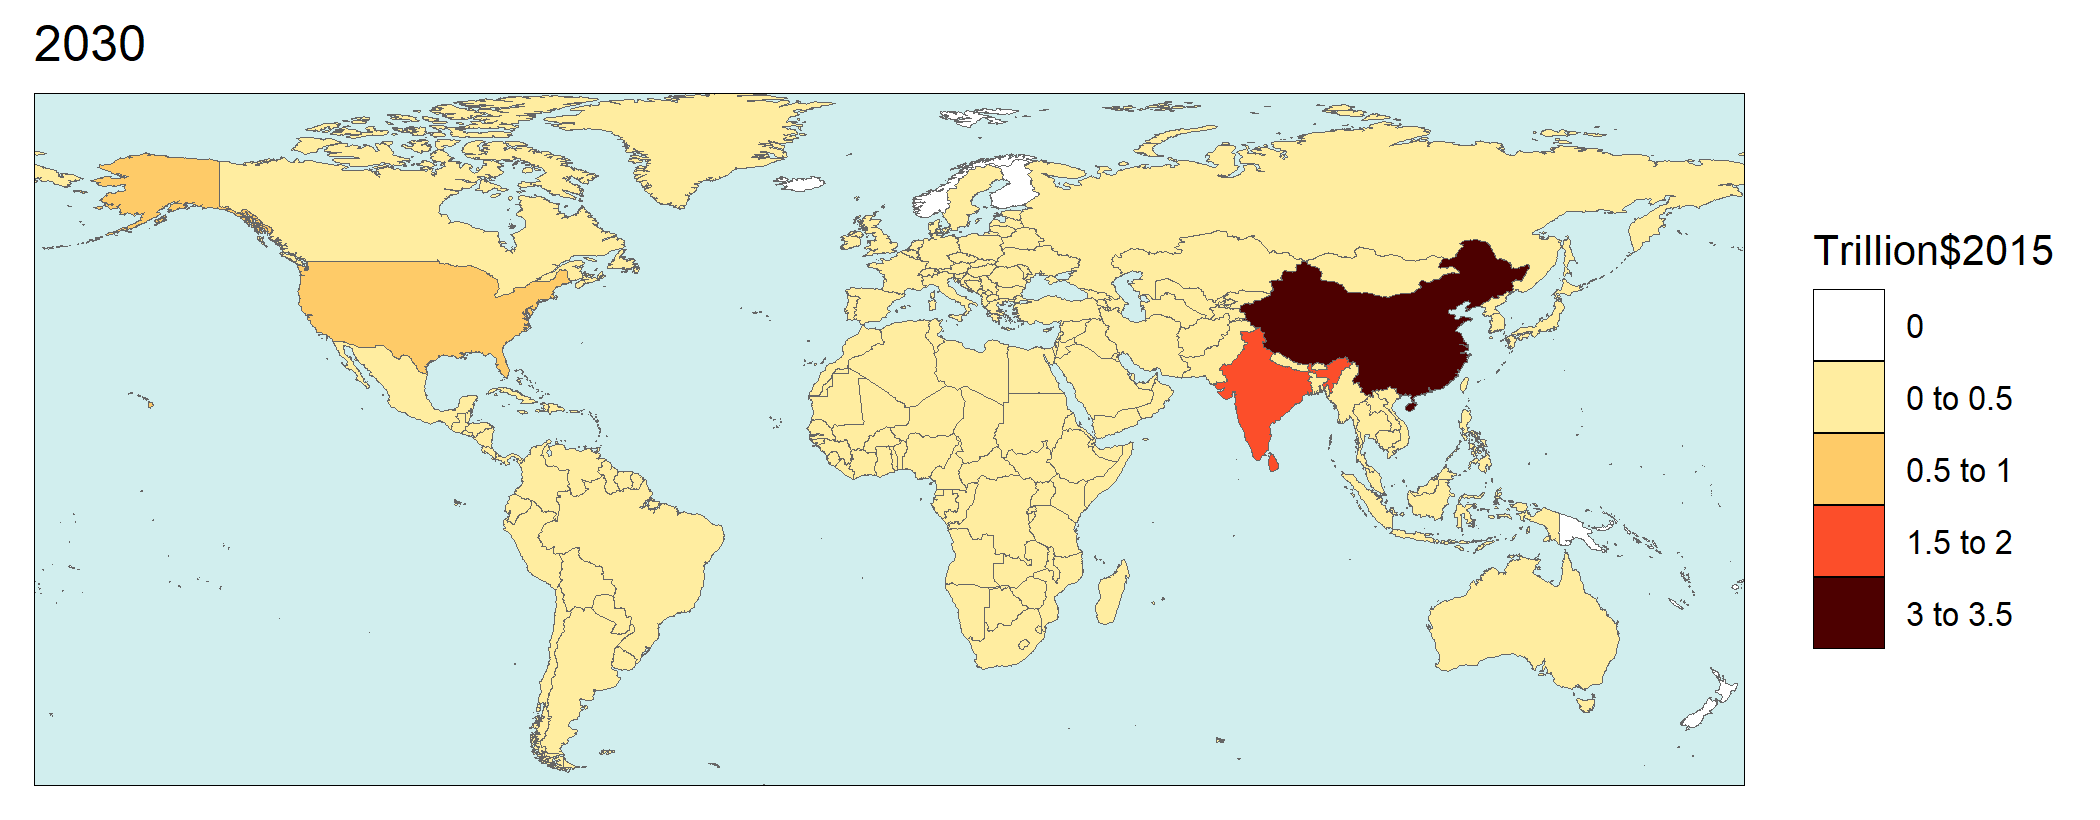
output sub-directory. As an example for this module, the following map
shows economic damages using the VSL approach.
Monetized damages attributable to PM2.5 concentration in 2030 ($Trillion)
